
Quantifiable Backup Data (QBD)
Manage subtasks in MS Project that do not require schedule logic
Definition
There are several publications as to "what" quantifiable backup data is. We're not trying to explain the "what". Actually, our goal is not even to explain the "why". Our goal is to provide you tools to manage QBD's. However, in order to understand what this application is trying to accomplish, the "what" and "why" might help you implement a better process. For the "what", take a look at this Humphreys and Associates article here. After you read this you might ask, "Why don't you just put each one of the steps in the schedule like every other activity?" One reason could be that the task takes longer than 2 accounting months and the subtasks (QBD) don't necessarily happen in an order that modern scheduling tools can easily model.
Why 2 accounting months? The point of QBD is to be able to objectively defend the reported earned value (percent complete) in a customer/government audit. The IPMR report formats are required once a month. You want to make sure you have something that clearly identifies progress on a monthly basis, at a minimum. A task that is base-lined to complete in one or two accounting months has the start and/or finish that objectively defends the percent complete. Can you assign QBD to a task less than 2 accounting months? Sure you can! The advantage is that you gain additional incremental milestones to increase your percent complete. However, you're setting yourself up to more scrutiny in a review of your data. Considering that QBD is subject to the same change control as a normal task, it's probably more trouble than it's worth.
The cake example is a good example of what a QBD is trying to accomplish but baking a cake doesn't take more than 2 months. (You'll notice percentages in their example. This QBD tool supports percentages as well as hours/currency) Later in the article they show a flowchart of the scientific method and engineering method. This is more likely to take more than 2 months and illustrates the problem. The issue is the decision loop(s). It's impossible to determine the number of loops it will take to meet requirements. Even though the analysis, design, and test steps are in a logical order it could take several iterations before the final product meets customer specifications. Once analysis is kicked off, an actual start date is entered into the schedule. However, entering a finish on the first attempt is risky because problems in design, test or requirements verification could force you to go back and re-analyze. If a finish is entered after the first try the task will probably not ever show up on another status request. If it does, that means earned value was taken one period and removed in another, creating negative earned value. Both are not ideal, but happen all the time.
There is a tendency for task owners and the planners(s) to set up the schedule like the image below. (You can find the full example below) Notice Analysis, Design, and Test are Finish To Start relationships. I think it's human nature not to plan for failure. Also, most schedules are products of highly competitive proposals. It's like a game of Name That Tune. Most companies propose they can "name that tune" in one note but pad the time and cost in Finish To Start relationships to factor in rework.

To model what's actually going to happen, a schedule might look like the image below. Analysis, Design and Test are now happening concurrently. However, that's not exactly what's happening.

If we had a crystal ball, we would know it took 3 tries. We could model what actually happened in the schedule, and it might look like this. Even in this example there's going to be some level of concurrency but the task duration's are short enough to be manageable as Finish To Starts. We don't have a crystal ball so your options are the 2 mentioned above and QBDs. There's issues with all three. Sometimes, you have to choose the one that carries the least risk of needing corrective action.

QBDs give you the option to model this type of work without worrying about the logic. It's important to remember that QBDs are considered supplemental schedules and are subject to the same change control requirements as a normal task.
Setup
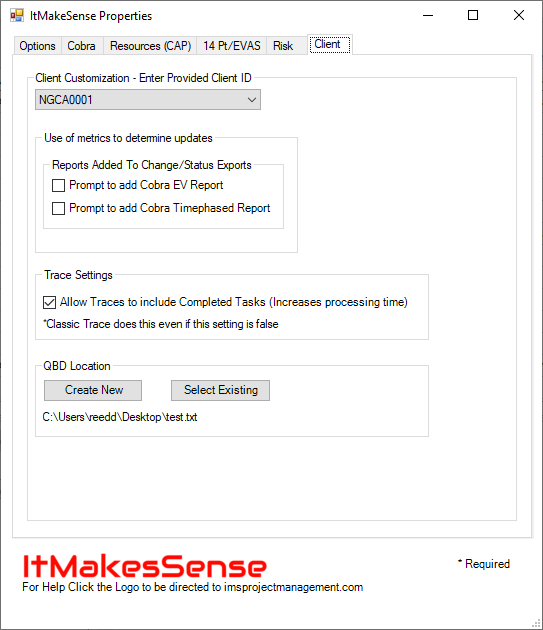
You can find the setup for QBDs in Application Settings - Client tab.
You will need to create a new blank .txt file or select an existing one.
You can select a location on a network drive but only one person will be able to edit the file at any giving time. The file is only opened to save the data and is immediately closed so this only becomes an issue if multiple users try to save at the same time. The saved data is serialized into QBD objects and will not be readable if the file is opened. However, the QBD form in the Add-in and the MS Excel Export and Import display the data in a human readable format. More information on this is below.
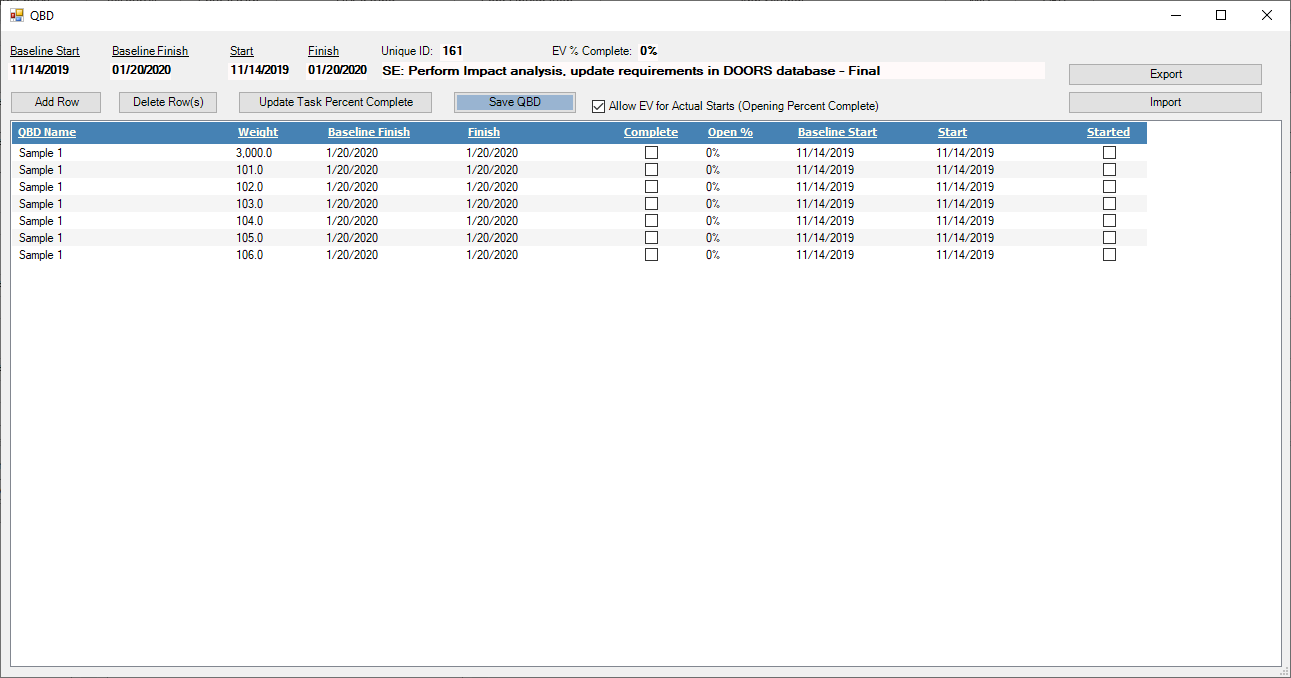
Task Level QBD Form
In the Add-in's ribbon you will find a button named QBD, under this menu is another button named Task Level QBD Form. This is where you can view, edit, or remove QBD information. Each task in a MS Project schedule is capable of having QBD subtasks. You can also calculate EV Percent Complete based on the QBD information. The EV Percent Complete field is defined in Application Settings - Cobra tab - Column P. In the form there is a check-box that allows earned value percent complete to be taken for the opening/start of a subtask. It's important to note that this is optional, some clients view QBD as objective criteria for only completion of subtask's. Open % allows EV percent complete on the start of subtask(s). In these scenarios, Actual Start's will increase the percentage of the weight that will be added to the total earned weight. Total Earned Weight / Total Of All Weights determine the tasks EV Percent Complete.
Make sure the active task is the task you want to view QBD data for then click Task Level QBD Form.
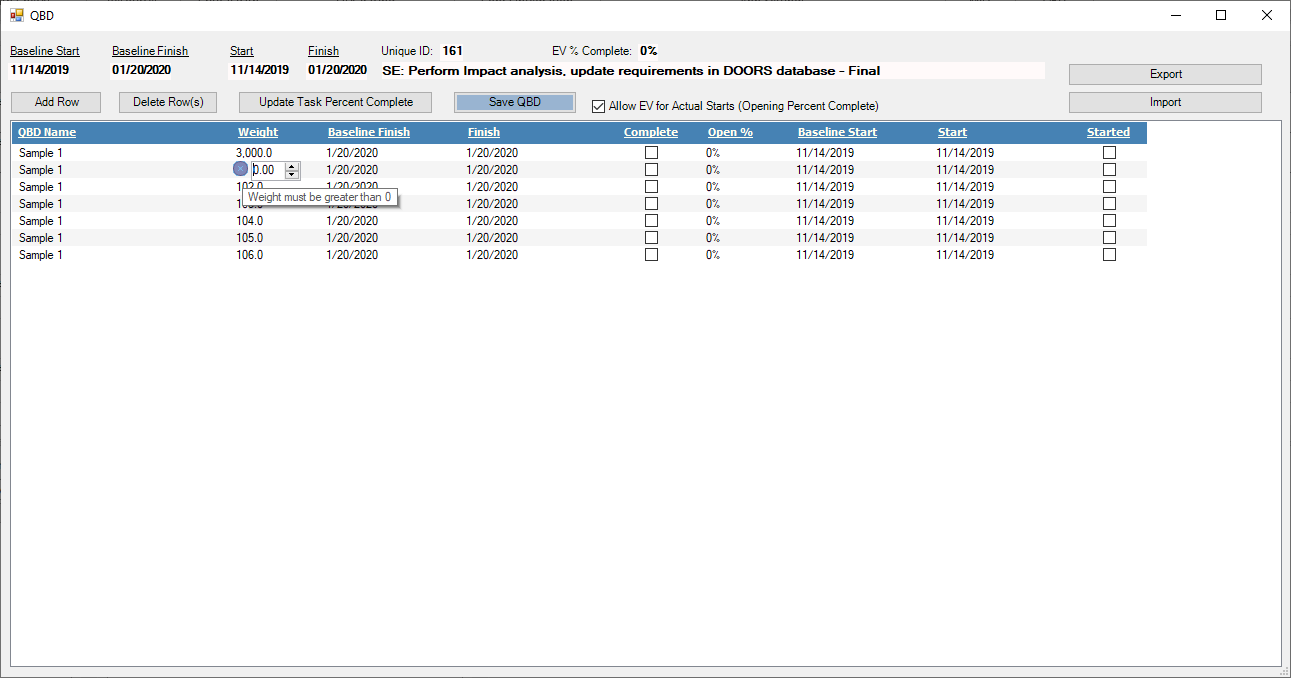
Warnings
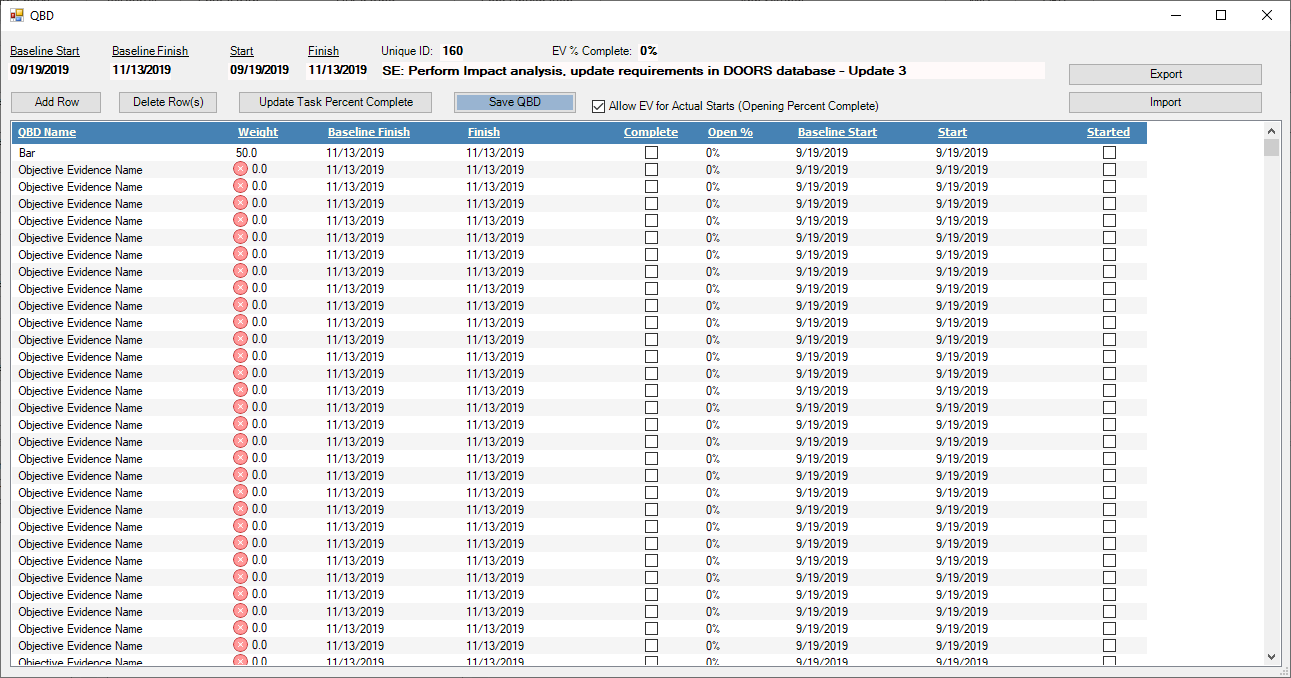
Warnings appear if the data does not make sense. Warnings appear if the Weight is less than or equal to 0, Dates don't line up with the Started and Complete flags, or Dates are outside the Min/Max values of the task.
Below is an example of a warning. A message with the warning description will appear if you click on the cell and hover the mouse over the warning image.
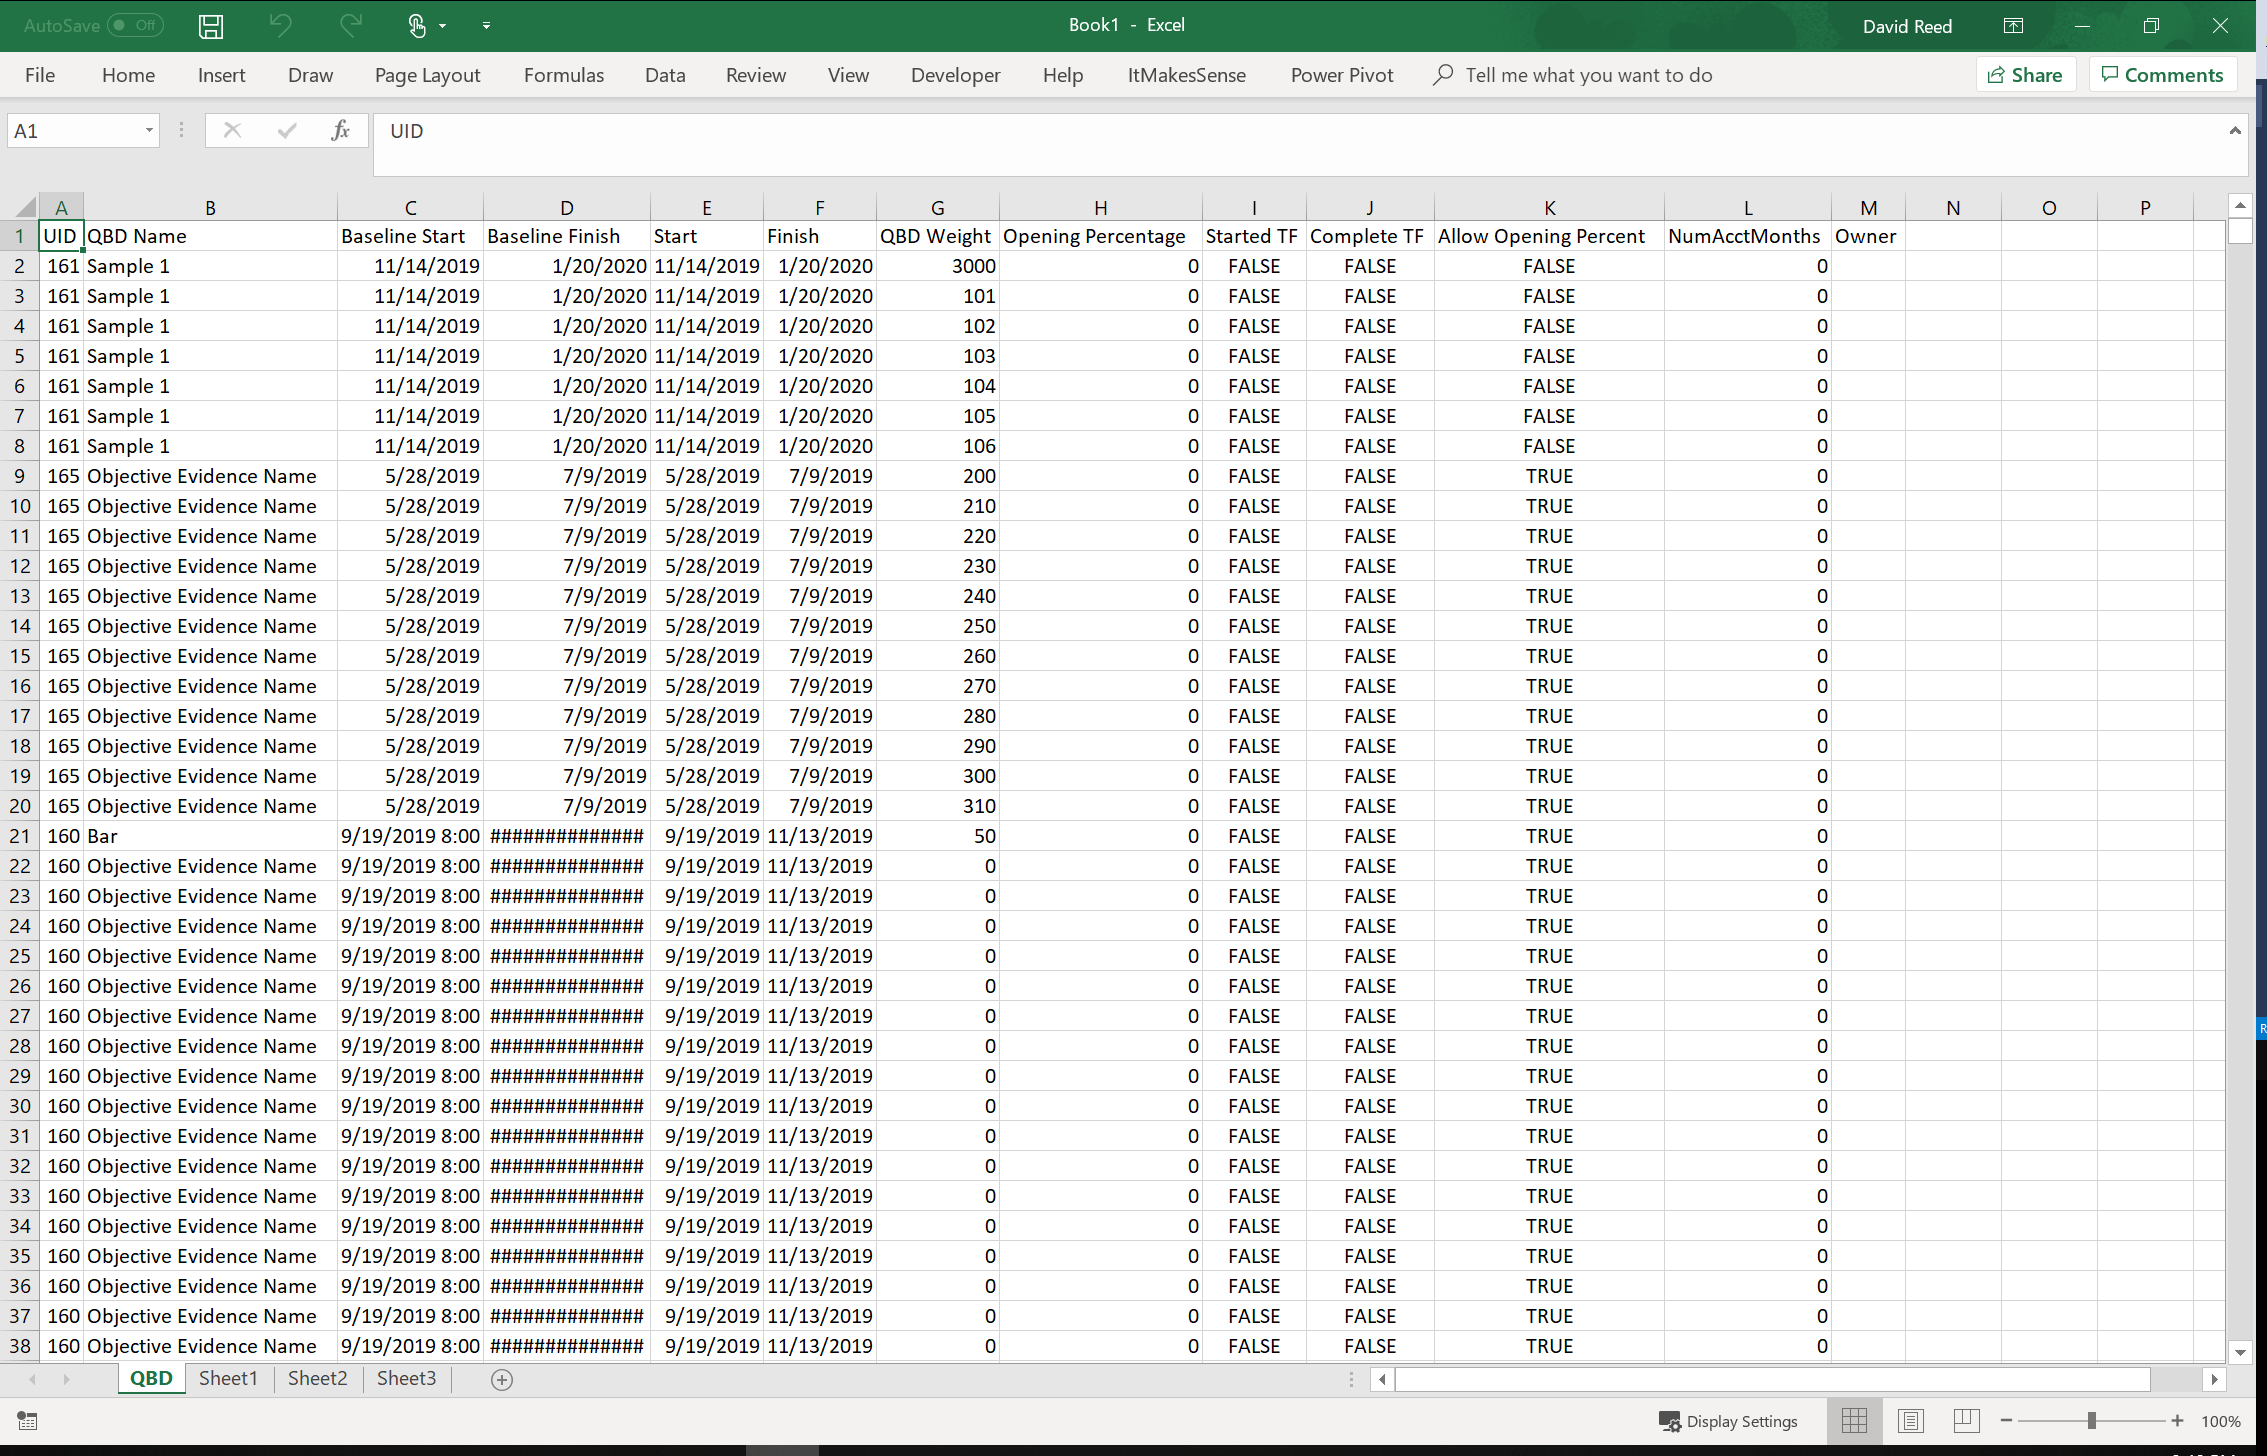
Export QBD Data
This button on the Ribbon will Export every task's QBD information. The format these are exported will be in the exact format that is required to import, if need be.
These are the fields exported
- UID
- QBD Name
- Baseline Start
- Baseline Finish
- Start
- Finish
- QBD Weight
- Opening Percentage
- Started TF
- Complete TF
- Allow Opening Percent
- NumAcctMonths
- Owner
Below is an example of an export.
Import QBD Data
This button on the Ribbon will import the file format discussed in the Export QBD Data section above. You will be prompted to Replace All or to just load the UIDs in the import file. Replace All will ask you if you want to export the current QBD as a backup. Replace UIDs will remove all of the current QBDs from the distinct list of the UIDs in the import file before it imports the file.
Below is an screen-grab of a QBD for one task that had over 5,000 entries.
Example 1 - Concurrent Engineering
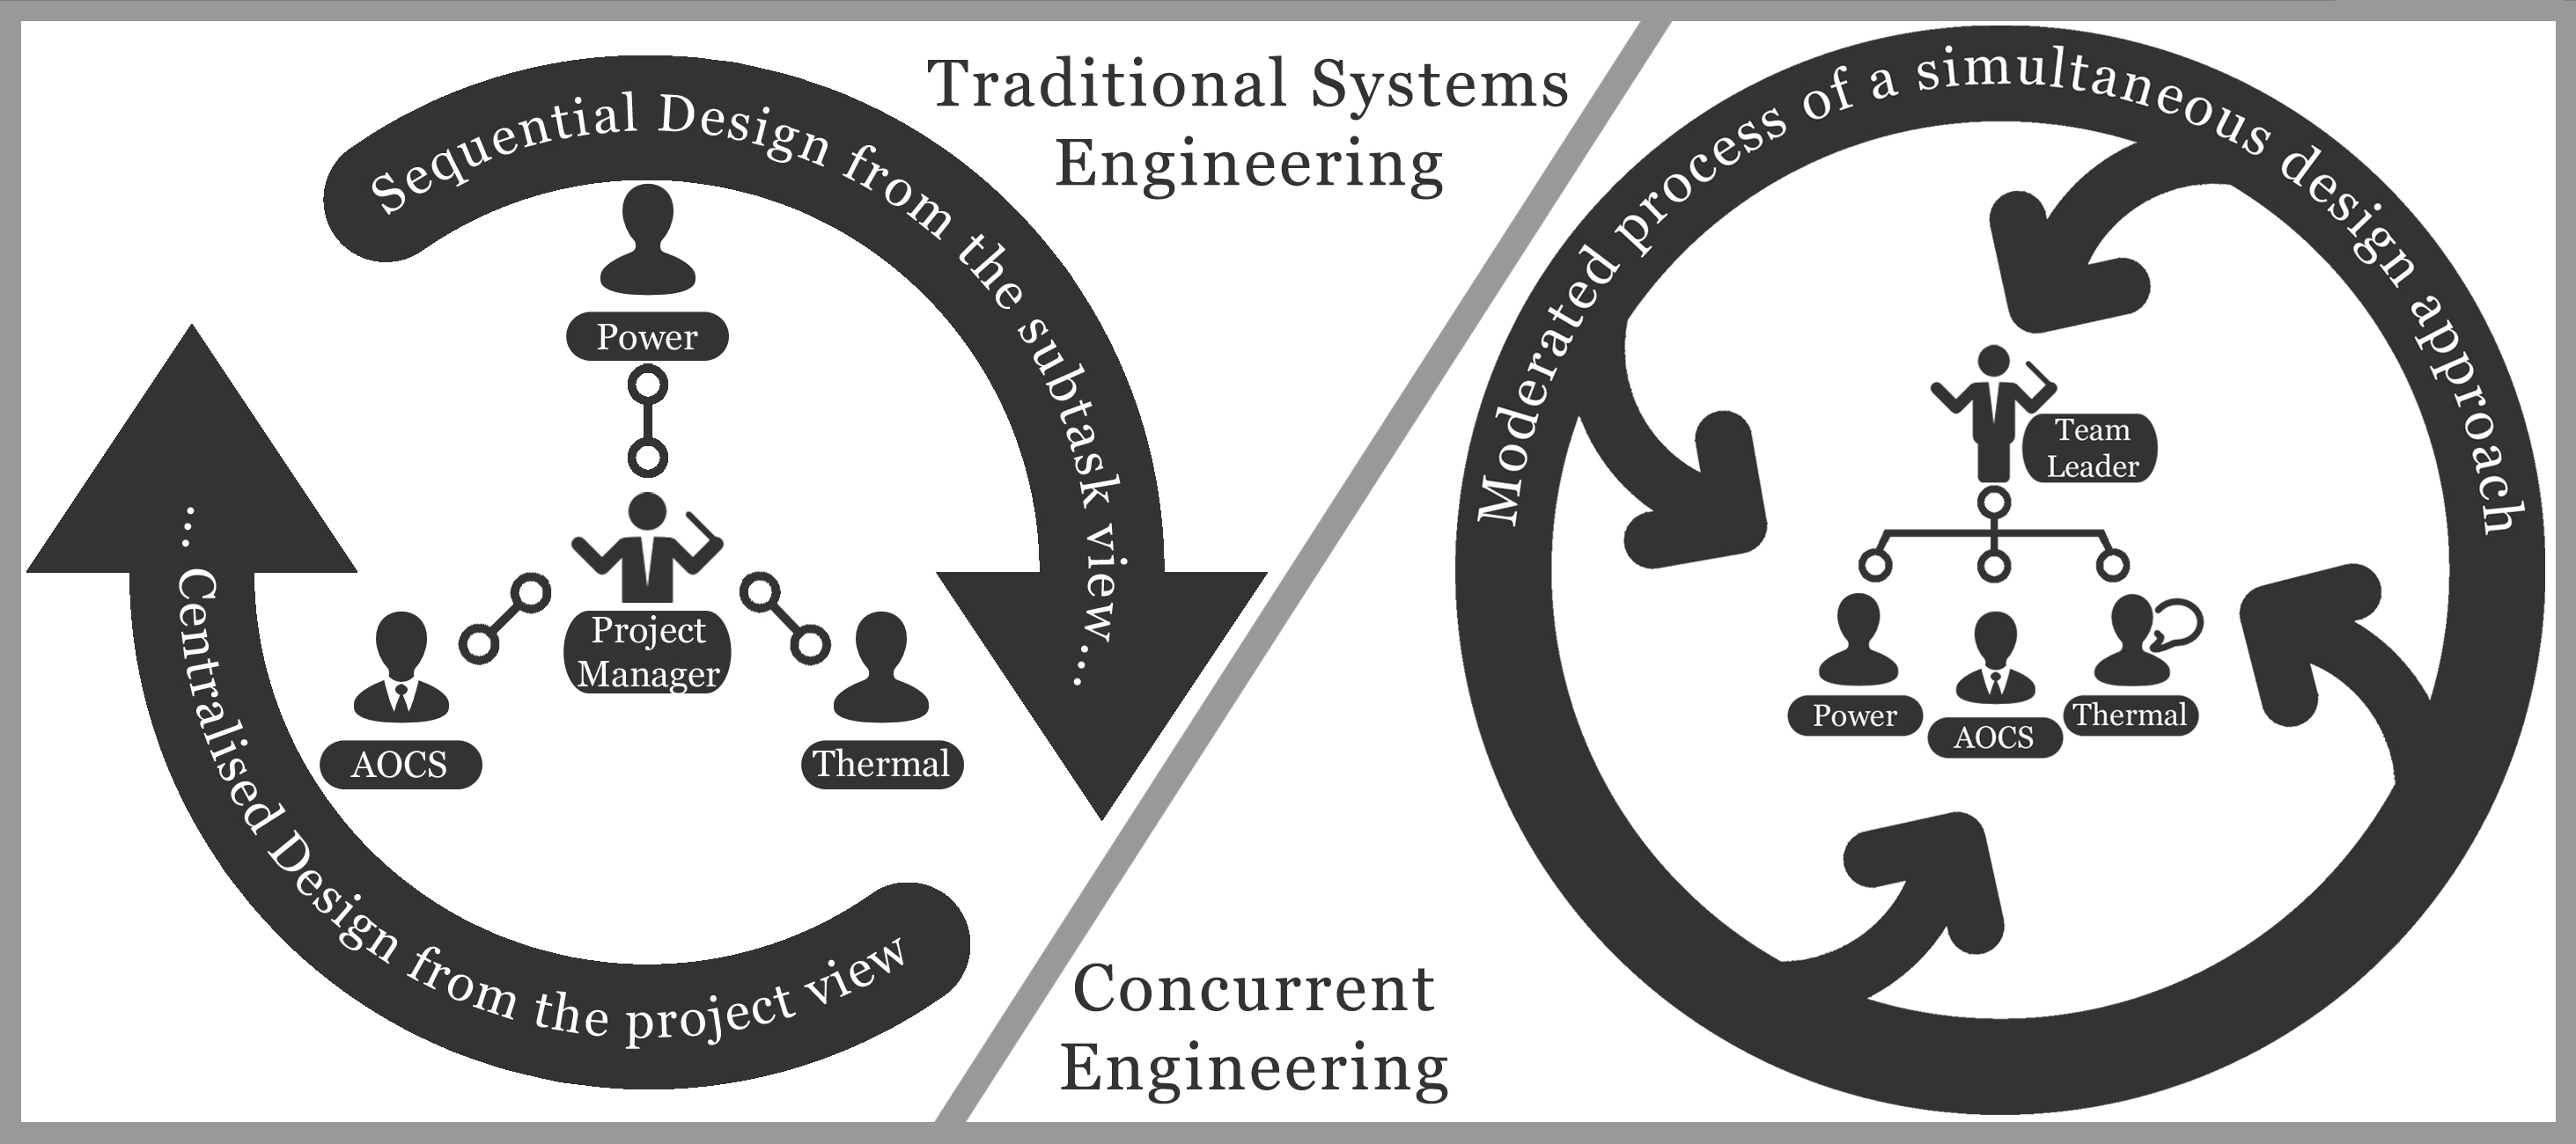
A car company recently announced that it would be developing a gasoline engine that will not need spark plugs. Instead, it will use extremely high compression to generate the heat required to ignite the fuel. This will result in a cleaner, ultra efficient engine with torque similar to diesel engines. Most, if not all of the engine parts will have to be redesigned. Let's imagine they're going to use the concurrent engineering model instead of the traditional systems engineering model. Click here for a great explanation of the difference.
Concurrent Engineering means that many, if not all, of the tasks that it takes to complete a part are going to overlap one another. Sure, putting these into a scheduling tool is possible but you'd end up spending more time trying to get the logic right on a weekly status basis than is possible for the average planner. Instead, companies tend to use QBDs for situations like these.
Below is an example of some tasks for this theoretical plan. Notice that each part is a task. In the systems engineering approach we would break these parts into additional tasks. This is still possible in the concurrent engineering model, it's just a nightmare to manage.

Instead, you can add QBD subtasks. Please note, this is only an example. There are many ways to do this. In fact, many companies will put some of the subtasks you see in the QBD below as MS Project tasks if they can be linked together in a timely and logical manner.

Example 2 - Low Rate Initial Production (LRIP)
If you read the definition section above you read that QBDs are like recipes. This is similar to production work instructions. They both list the steps it takes to complete a bigger task. Work instructions lack the ability to calculate performance unless you benchmark each step. This is called Production Standards. Each step in the work instructions is assigned a standard amount of time/money it takes to complete it. Sound familiar? This is equivalent to a schedule baseline. Since each step is weighted it's possible to derive a percent complete based on the weight of the steps complete divided by the total weight of a given unit. If you were to build 1,000 units many of the units are going to be done concurrently. Production standards, like QBDs, provide you insight into your progress even though you might not have completed a single unit. Because there's so many steps many companies have sophisticated material requirements planning systems (MRPs) that can produce the earned value based on the production standards.
By the time you've reached full-rate production you've probably moved the majority of the time management aspect of the units from the scheduling tool to the MRP system. If you haven't already retired the EVMS schedule because the R&D/LRIP contract requirements have been met it's still possible to have general tasks that represent several units. I mention LRIP (Low Rate Initial Production) because this is more likely where you can implement QBDs to do the job of a MRP in a schedule. Not all the work, just the performance management aspect of it. It could be that you don't have a MRP yet, or that you want to move the evidence of completion to the schedule. Whatever your reasons are you can design the QBDs in a manner that mirror work instructions. Your LRIP contract probably doesn't call for thousands of units. It could be 1, 10, 100, but probably not 1,000's. Let's say it's 100. You could create the work instructions once and import that one QBD into 100 tasks in the schedule. One of the biggest advantage of this is that the performance is controlled by the schedulers and not the task owners. Not centralizing performance management with objective evidence carries a greater risk of non-compliance (Under/Over stating performance).
Example 3 - Procurement
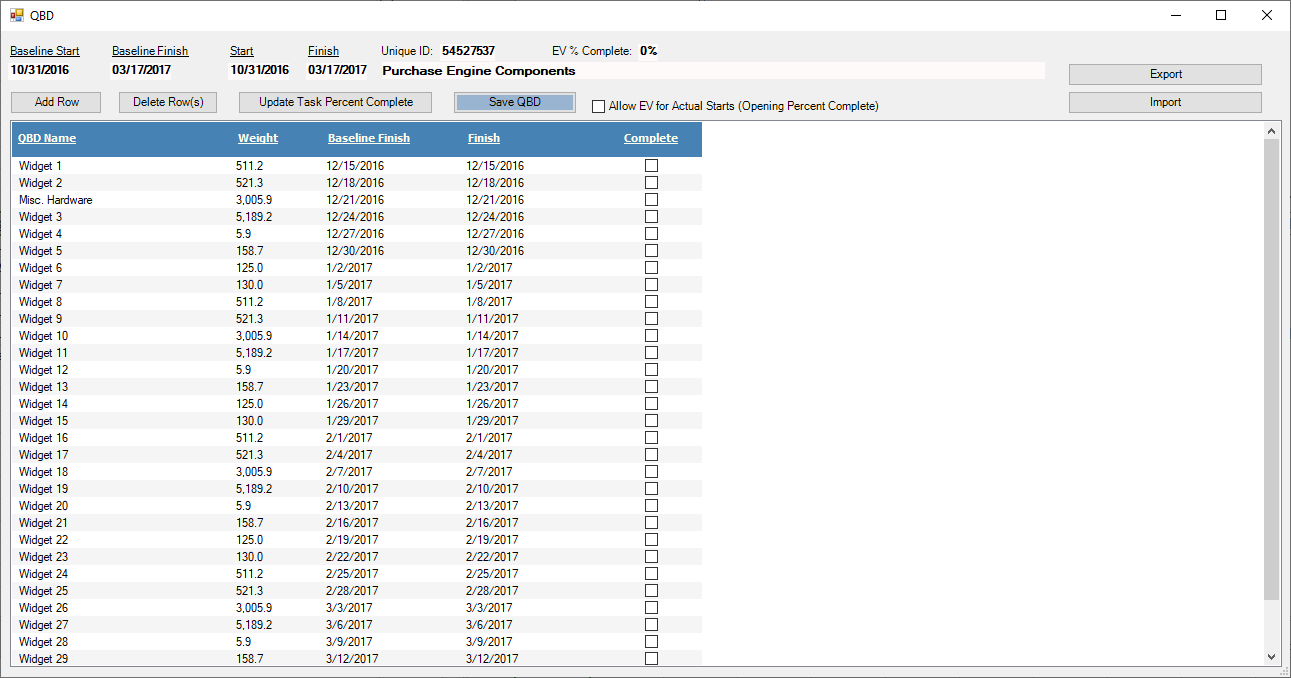
Often times purchase orders can contain many parts over a long period of time. In this example the schedule only cares about when all part(s) are received and available for consumption. However, you need a way to track the status of these parts since they are high dollar and the period of performance of the purchase order spans multiple months. It's not necessary to create a task for each item, instead you can use QBDs to keep track of the purchase order items.
Staying with the scenario in Example 1, let's say we want to order all of the parts for the engine to build one prototype. Let's also assume this is considered high value material (High Dollar/Value material is usually defined in the companies Earned Value System Description or command media)
The task that the QBD below represents is 100 working days long but it contains some deliverables that trigger progress payments. Granted, this is probably overkill for a 100 day task but it illustrates a point that you can keep track of a purchase order in the schedule and calculate an earned value percent complete with relative ease. From working with many clients I've noticed that, more often than not, the EV percent complete for a task like this would come from the task owner and when audited, it was common they would not be able to defend their percent complete.
Frequently Asked Questions
Coming soon
- Why don't you connect this to a QBD database?