Resource Management and Status
See the Proposal section for a quick overview of how to price data. (Links back to this page often)
Export to Excel in multiple ways. Work, Cost, and many more time-scaled assignments can be exported. Work/Cost or Baseline Work/Baseline Cost is exported into one consolidated report. Export Monthly, Weekly, or Daily out of the box. 'Any' Period End combination can be exported by loading a custom calendar. Do What-if's on Baseline 1-10, even export remaining values by selecting Calculate From Status Date Forward in Application Settings. There are a variety of ways to customize the export including custom assignment fields and custom curves. Status conditional formatting can also be applied to the Time-phased Report and Change Control templates.
Status
Make sure to read the sections below to figure out the best way to do this export.
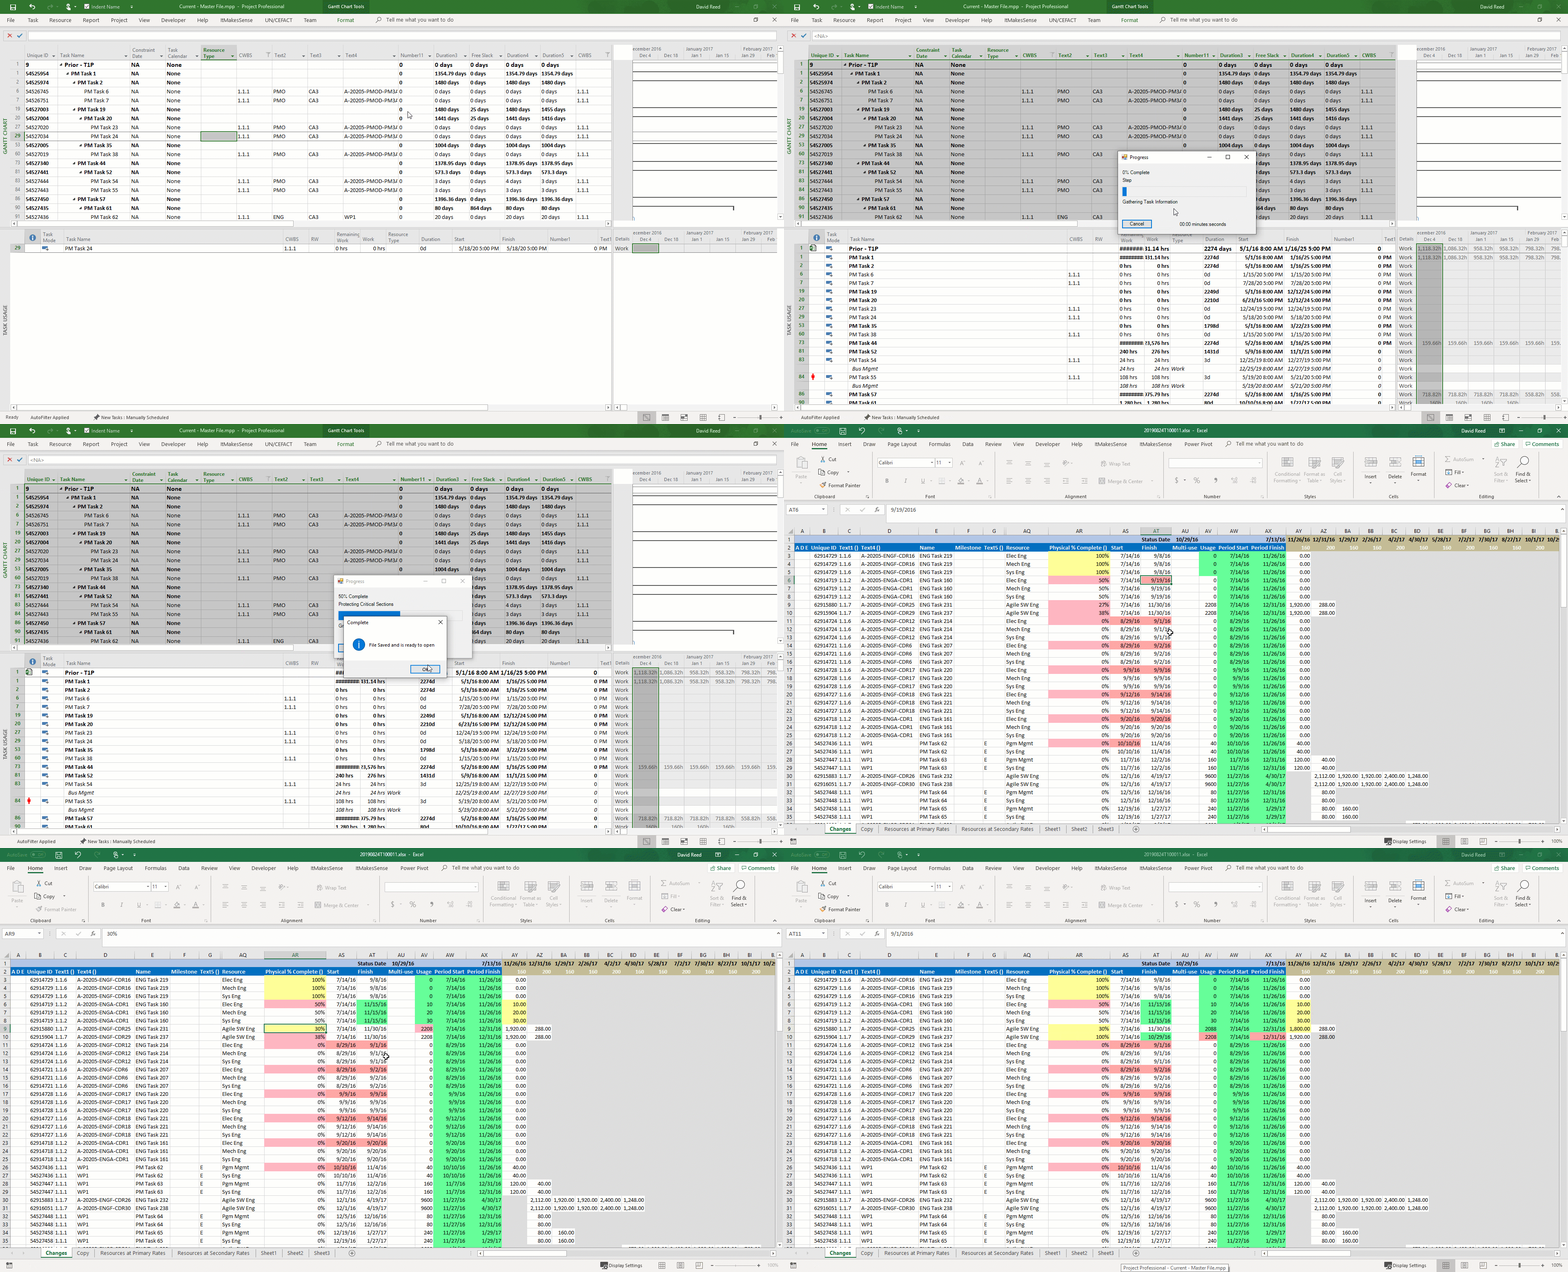
Any one of the methods in the section below can produce a MS Excel status file (workbooks grouped by any MS Project field). The .gif below shows one example of the thousand ways you could export data from MS Project.

Cost
Make sure to read the sections below to figure out the best way to do this export.
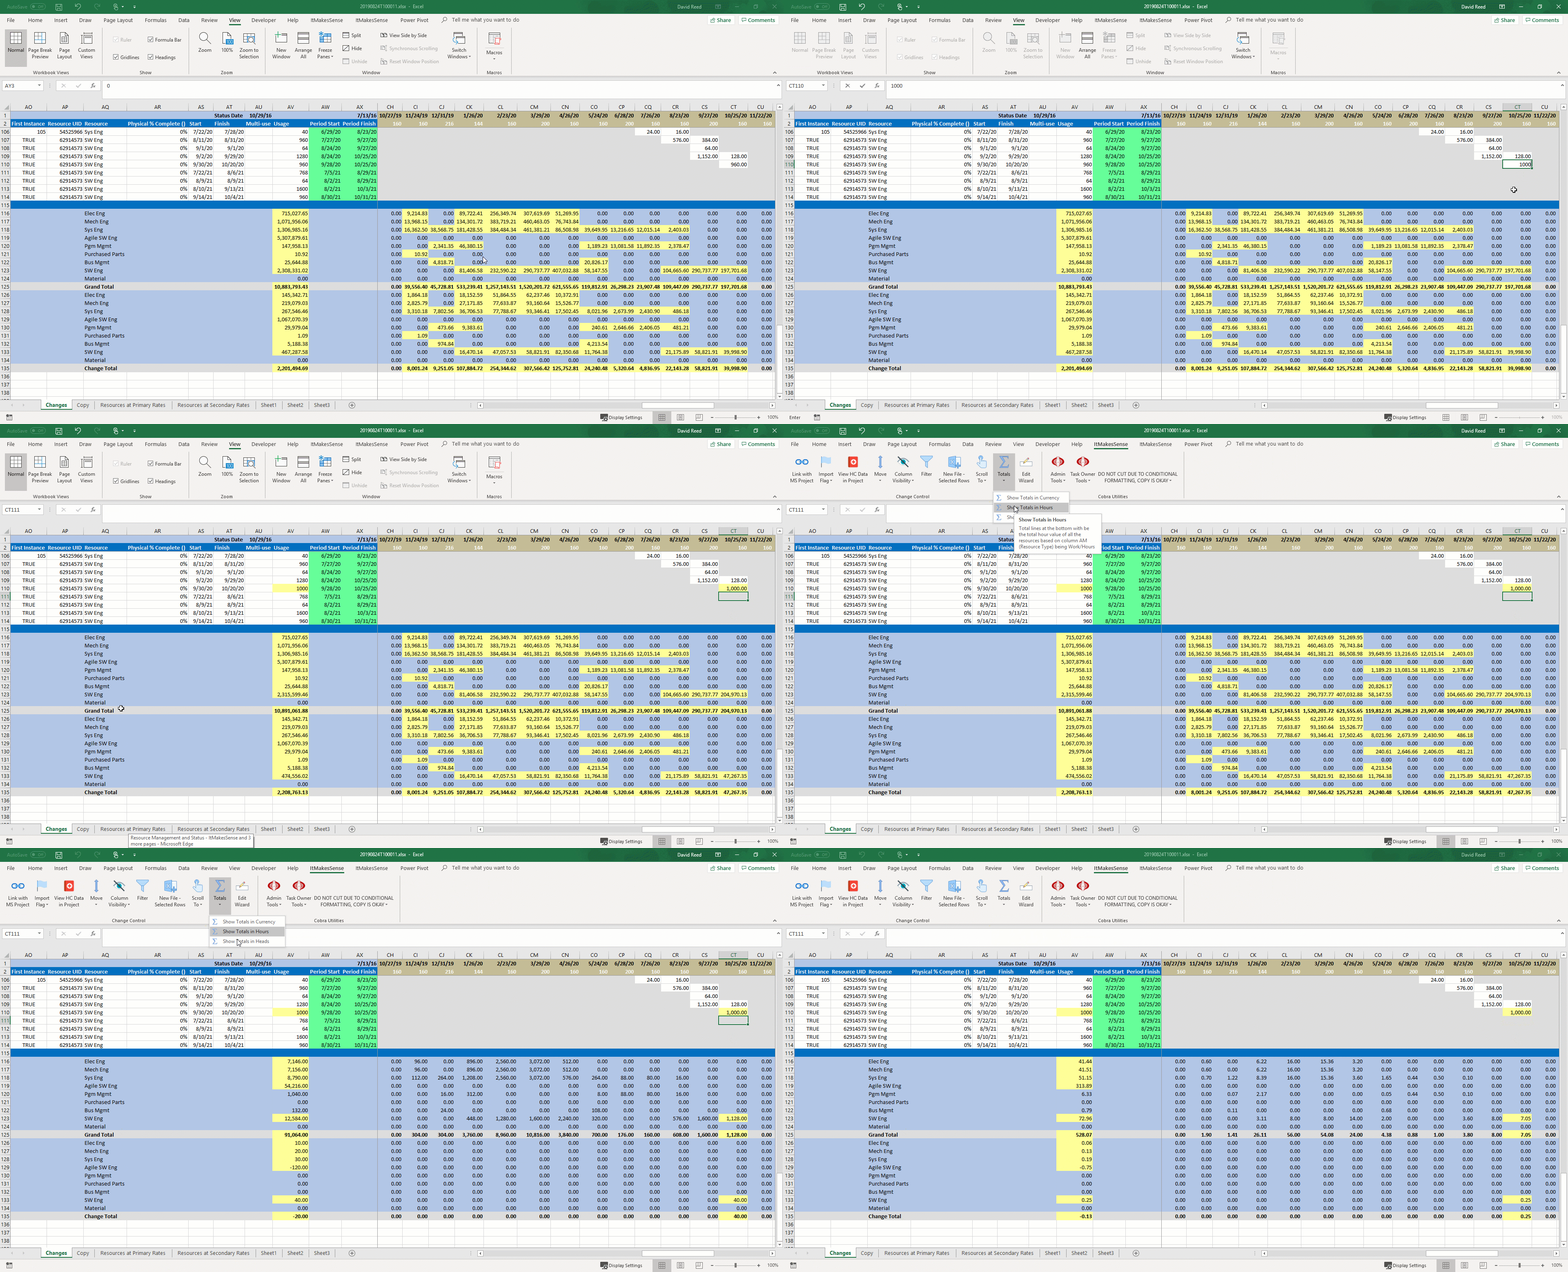
Cost can be calculated in any of the resource exports and reports that produce pivot data. Below is a .gif of the one of the above status exports that shows one of the Excel add-in's features of switching between showing cost, hours, or heads as the total at the bottom of the status file.

Tutorials
- Load Calendar
- Create Primary and Secondary Rate Files
- Timephased Report/Status/Change Control Report Definition
- Create A Status File Using MS Project Resource Assignments Remaining Work/Cost
- Update Forecast and Status File - Tutorial Under Construction
- Transfer Data from the Timephased Report back to MS Project
- Coming Soon
- Export Resource Information without using Assignments
- Export Resources at the task level
- Using Curves Option
- Blending numbers and characters in Usage (Column AU)
Task Level Pivot Data
Creates a Cobra resource file and a flat file with several custom fields and MS Project resource data at the Task Level that can be pivoted.
Why the task level, you might ask? Some companies keep it very simple and have one resource per task. In these cases it's not necessary to load assignments using MS Projects native resource loading. Companies that use this method typically have condensed their resource pool to very general categories and rely heavily on rate/volume analysis to determine the blended average of these resources. For example, Company X might have 20+ specific resources just for engineering (Level 1-5 Engineers for Software, Systems, Electrical, Test, etc.). Company X would then have to use MS Project assignments because a Software Engineering Task could require up to 5 levels of Software Engineers. Conversely, Company Z groups all these levels into one general Engineering category. There's a good possibility that each task in MS Project only requires one resource and based on prior experience they know that the average rate is $XX.XX. There's nothing wrong with this method, but it does require you to periodically analyze your budgeted rate to the actual rate and adjust your budgeted rate accordingly. The benefit is an extremely easy way to do resource planning.
This typically requires 2 custom fields, one for the resource and another for the direct hours/dollars or weights. The tool will do the rest. It will spread the resources based on a curve (if defined) or linearly if not defined.
Task Level Time-phased Report with Change Control - Grouped
Creates a Time-phased report/Status File grouped by any MS Project field.
Make sure to read the Task Level Pivot section above to understand what Task Level means.
Instead of presenting the data in a flat file this button will display the data by period (defined by the loaded Calendar, Day, Week, or Month). There are also prompts that will ask how you want to group the data and whether or not to put Status Conditional Formatting in the file. Status conditional formatting helps the end user know which tasks need updates. An Excel workbook is created for each group.
Task Level Compare App Settings Resources 'Column AU' To Another Schedule
Creates a flat file with resource data from 2 different schedules that can be pivoted.
Make sure to read the Task Level Pivot section above to understand what Task Level means.
This performs the same function as the Task Level Pivot except it will prompt you for another MS Project schedule to do comparison. This button will also ask you whether you want to use Primary or Secondary rates (Optional) for the comparison schedule (The one it asks you to open). In this way you can have ultimate control over the backup data you need for Budget At Complete (BAC) changes or Estimate At Complete (EAC) changes. If a rate file is set up for it you can also include fringe benefits, labor overhead, procurement overhead, general and administrative, and facilities capital cost of money. (Up to 15 custom 'burdens')
Assignment Level Pivot Data
Creates a Cobra resource file and a flat file with several custom fields and MS Project resource data at the Assignment Level that can be pivoted.
This button goes down to the Assignment Level to find the usage value. The unique aspect of this utility is that you do not have to use MS Projects Assignment Usage Types (Work/Cost, BaselineWork/BaselineCost, etc.). That doesn't mean it doesn't work with them. In fact, the main reason people use this Add-in is to export MS Project Assignments into a status file. That's why there is a check box in Application Settings - Resources (CAP) tab to 'Mirror Project Assignments'. This will export any of MS Projects Assignment Types exactly as they lay in the TimeScaleValue interface. However, disabling this check box allows you to choose any MS Project custom field at the assignment level.
Using custom fields at the assignment level does the same thing that the Task Level buttons can do. This prevents MS Project from automatically changing your remaining work as you update status and puts the onus on the task owner. Again, this is not a tool defining feature of the Add-in but it is an option. If you don't have the flexibility to have one resource per task (this is rare and talked about in the Task Level Pivot section) you can still have a minimalistic approach to resource planning. Unlike the task level, you will have to create MS Project resources. However, it is not necessary to assign rates (handled by importing Primary and Secondary Rates if you want them). The only two remaining steps are to choose the resources needed for each task and choose any MS Project custom field to put the direct hours/dollars in. The tool does the rest by spreading the resources linearly and/or by custom curves.
As mentioned above, one of the main draws of the application is the ability to 'Mirror Project Assignments' and export Excel status files (one workbook for each unique grouping). Some tools struggle with the fact that MS Project uses 2 assignment types that make up 1 entity. Work/BaselineWork defines the direct hours and units, Cost/BaselineCost defines the direct currency/dollars. These 2 are typically combined to make up ones Estimate To Complete (ETC) or Budget At Complete (BAC). In order to export all direct elements this Add-in determines which 2 should accompany one another. If you chose Work, Work is exported and its counterpart, Cost, is exported to fill in the direct dollars gap (typically Material and Subcontract cost). The same goes for BaselineWork and BaselineCost, BaselineWork1 and BaselineCost1, etc.
Assignment Level Time-phased Report with Change Control - Grouped
Creates a Time-phased report/Status File grouped by any MS Project field.
Make sure to read the Assignment Level Pivot section above to understand what Assignment Level means.
Instead of presenting the data in a flat file this button will display the data by period (defined by the loaded Calendar, Day, Week, or Month). There are also prompts that will ask how you want to group the data and whether or not to put Status Conditional Formatting in the file. Status conditional formatting helps the end user know which tasks need updates. An Excel workbook is created for each group.
Baseline Change Template - Grouped
Creates a Time-phased report baseline on BaselineWork/BaselineCost grouped by any MS Project field.
Make sure to read the Assignment Level Pivot and Assignment Level Time-phased Report with Change Control - Grouped sections above to understand what Assignment Level means and understand how this differs from the section above.
This is a template for one of the most popular way to export a group of Excel workbooks for updates. Instead of having to change Application Settings, this will automatically assume you want to export BaselineCost/BaselineWork the exact way MS Project has laid the resources out in TimeScaledValues. You will still be prompted to chose a grouping that defines each Excel workbook split.
Forecast Change and Status Update Template - Grouped
Creates a Time-phased report/Status File based on Remaining Work/Cost grouped by any MS Project field.
Make sure to read the Assignment Level Pivot and Assignment Level Time-phased Report with Change Control - Grouped sections above to understand what Assignment Level means and understand how this differs from the section above.
This is a template for one of the most popular way to export a group of Excel workbooks for updates. Instead of having to change Application Settings, this will automatically assume you want to export Cost/Work the exact way MS Project has laid the resources out in TimeScaledValues. The check box calculate from status date forward is also hard coded to make this template just Remaining Work/Remaining Cost. You will still be prompted to chose a grouping that defines each Excel workbook split.
Assignment Level Compare App Settings Resources 'Column AU' To Another Schedule
Creates a flat file with resource data from 2 different schedules that can be pivoted.
Make sure to read the Assignment Level Pivot section above to understand what Assignment Level means.
This performs the same function as the Assignment Level Pivot except it will prompt you for another MS Project schedule to do comparison. This button will also ask you whether you want to use Primary or Secondary rates (Optional) for the comparison schedule (The one it asks you to open). In this way you can have ultimate control over the backup data you need for Budget At Complete (BAC) changes or Estimate At Complete (EAC) changes. If a rate file is set up for it you can also include fringe benefits, labor overhead, procurement overhead, general and administrative, and facilities capital cost of money. (Up to 15 custom 'burdens')
Frequently Asked Questions
Coming soon
- Why are certain cells in some Columns locked in the Time-phased report?
- What do the conditional formatting colors mean in the Time-phased report?
- Earned Value is included in the Time-phased report exports. How is it calculated?
- Why can't I sort the Time-phased report after it's exported?
- Do I have to load a custom Calendar?
- Do I have to load custom rates?
- Should I export Monthly, Weekly or Daily data?
